
Welcome to the first article of Local Marketing Insider, a newsletter by Widewail.
Before we get into the 7 Review Performance Benchmarks for 2021, I’d like to introduce myself – I’m Jake, I work on the marketing team at Widewail. With the help of experts on the Widewail team, I’ll be putting together Local Marketing Insider Article two times per month.
I’ll share stories, insights, and data points about reviews, search, social proof, local SEO and social media.
This is a content-only newsletter/article with bite-sized, to-the-point, trend-driven stories that are easy on the eyes. If you enjoy it, please share it with friends and colleagues.
For issue #002 I’ll be looking at how the use of search modifiers has evolved in the last 15 years and new trends that local businesses can leverage today.
Here’s a sample, looking at “Cheap vs. Best” from 2004-2020:

7 Review Performance Benchmarks for 2021
We say this often, but it’s certainly worth repeating, reviews are ongoing and ever-evolving. Putting lifetime numbers aside, how was your performance in the last 2 weeks? Fresh positive content is key for Google and your prospects.
Goal for 2021: Double your monthly review volume (~50-70).
2019: 13.4%
2020: 12.1%
Although the change is minor YoY, I’m always pleasantly surprised to see almost 90% of reviews are positive. Not to mention the uphill battle local businesses faced with COVID-19 in 2020.
Negative reviews get a lot of attention, but the overwhelming majority of local business customers are pleased with their experience. You just have to get them to share their experience publicly.
2020: 4.5
Bravo. Love a good 4.5, the perfect combo of quality and trustworthiness.
Goal for 2021: By asking customers to leave reviews in a way that is convenient for them, businesses see an average rating lift of 0.3 stars in 30 days.
Of the 4,459 reviews, the consensus rating was 4.1.
The pandemic brought a wave of new challenges and rules for local businesses to tackle. I shared this with the Widewail team, we are very impressed.
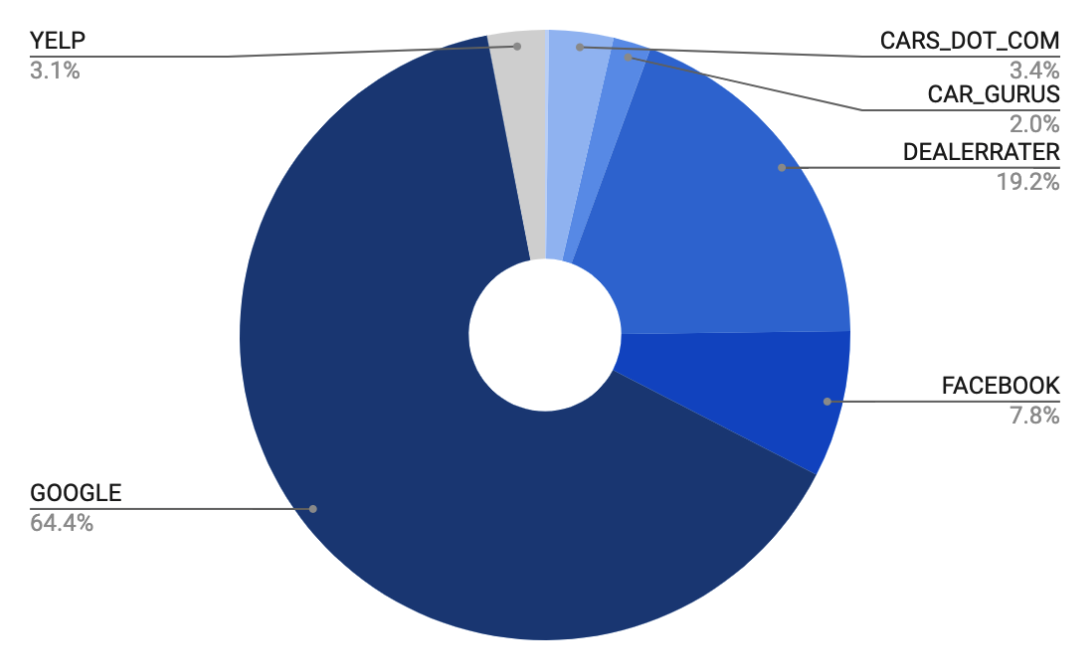 Where dealers are getting reviews:
Google continued to rule the review sites in 2020, but DealerRater is a standout second at 19%, well ahead of Facebook’s 8%.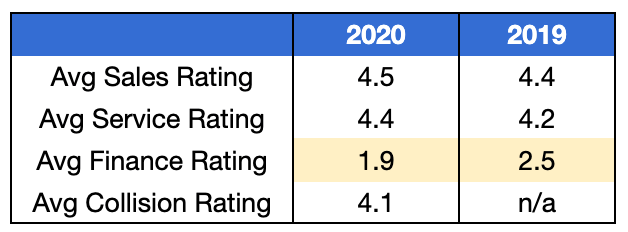
Finance reviews leave room for improvement – but then again only so much you can do when customers are confronted with the bill ♂️.
If you enjoyed this issue please share it with friends or colleagues.
Before we get into the 7 Review Performance Benchmarks for 2021, I’d like to introduce myself – I’m Jake, I work on the marketing team at Widewail. With the help of experts on the Widewail team, I’ll be putting together Local Marketing Insider Article two times per month.
I’ll share stories, insights, and data points about reviews, search, social proof, local SEO and social media.
This is a content-only newsletter/article with bite-sized, to-the-point, trend-driven stories that are easy on the eyes. If you enjoy it, please share it with friends and colleagues.
For issue #002 I’ll be looking at how the use of search modifiers has evolved in the last 15 years and new trends that local businesses can leverage today.
Here’s a sample, looking at “Cheap vs. Best” from 2004-2020:
7 Review Performance Benchmarks for 2021
- Monthly average: 29 reviews/store
- 12.1% negative sentiment
- 4.5 average rating
- 4.1 average COVID-related rating
- Google accounted for 64.4% of automotive reviews
- Average negative rating 1.5
- Automotive sales departments lead with a 4.5 average rating
1. Average monthly volume: 29 reviews per store
Nice work. A consistent frequency of reviews provides your prospects with the context and confidence that your business is a good choice for them today.We say this often, but it’s certainly worth repeating, reviews are ongoing and ever-evolving. Putting lifetime numbers aside, how was your performance in the last 2 weeks? Fresh positive content is key for Google and your prospects.
Goal for 2021: Double your monthly review volume (~50-70).
2. Negative sentiment improved in 2020
But just a smidge. The percentage of negative reviews:2019: 13.4%
2020: 12.1%
Although the change is minor YoY, I’m always pleasantly surprised to see almost 90% of reviews are positive. Not to mention the uphill battle local businesses faced with COVID-19 in 2020.
Negative reviews get a lot of attention, but the overwhelming majority of local business customers are pleased with their experience. You just have to get them to share their experience publicly.
3. Ratings remain good but largely unchanged from 2019
2019: 4.472020: 4.5
Bravo. Love a good 4.5, the perfect combo of quality and trustworthiness.
Goal for 2021: By asking customers to leave reviews in a way that is convenient for them, businesses see an average rating lift of 0.3 stars in 30 days.
4. Customers were satisfied with COVID safety measures
Throughout the year we tracked all reviews mentioning COVID-19 or related terms.Of the 4,459 reviews, the consensus rating was 4.1.
The pandemic brought a wave of new challenges and rules for local businesses to tackle. I shared this with the Widewail team, we are very impressed.
5. For auto, Google is still #1, DealerRater second
- Google: 64.4%
- DealerRater: 19.2%
- Facebook: 7.8%
- Cars.com: 3.4%
- Yelp: 3.1%
- CarGurus: 2.0%
- CarFax: 0.2%
Google continued to rule the review sites in 2020, but DealerRater is a standout second at 19%, well ahead of Facebook’s 8%.
6. Average negative sentiment rating was 1.5
(we consider a negative review 3-stars or less)3-stars is not the new 1-star. Frustrated customers still prefer to make it sting.7. For dealerships, sales edged out service
Finance reviews leave room for improvement – but then again only so much you can do when customers are confronted with the bill ♂️.
If you enjoyed this issue please share it with friends or colleagues.
————————————————————————
I’m Marketing Manager here at Widewail, as well as a husband and new dad outside the office. In Vermont by way of Boston, where I grew the CarGurus ...


Current Discussion Topics