To a lot of managers, the thought of yet another monthly vendor report is about as exciting as an empty dealership on Saturday afternoon.
I get it – you’re busy, you’ve got a system, things are “okay.” But that’s a losing way of thinking. In the world of big data and advanced analytics, failing to embrace all of the information available to your dealership will only put you at a disadvantage.
Do you think Berkshire Hathaway Automotive runs the numbers? I sure do.
Elevating Our Metrics
Before I get into some of the new tools you can you use to tailor and improve your store’s presence on Cars.com, I want to level the conversation.
I realize that though there are more than 20,000 dealerships nationwide running with Cars.com, there are also some that aren’t. Without getting into the weeds about which companies to partner with and why, I hope the following builds on a much more important conversation about what types of metrics we look at to determine success within our industry.
Unfortunately, I still hear the same basic feedback during most of my training sessions.
“Jack, I need more leads. We’d be crushing it if we just got more emails and phone calls,” they say.
But the reality is that the pesky metric we’ve been laser-focused on for more than a decade is quickly fading away. In its place, impressions, page views, referrals, maps views, chats and a host of new metrics are starting to paint a better picture of what’s actually going on at our dealerships.
New-car sales are up, yet traditional lead submissions are flat across the industry. What does that tell us about the way consumers are choosing to interact with dealerships?
What’s In The Box?
Last month, Cars.com rolled out a brand new suite of reporting tools for our dealer-partners. If you’re familiar with our old tools, you can visit dealers.cars.com and log in just as you did before. If not, I encourage you to reach out to your local Cars.com rep, or our customer support team to get access right away.
While I won’t get into every new feature in this post, the biggest upgrades we’ve made are the result of a renewed focus on local market insights and actionable information that can improve your performance on Cars.com, all within an easy-to-access, central location.
Once you log into your account, you’ll see familiar options to manage dealer reviews, add content to your dealership profile page and update your inventory. Skip that for now and head straight to the new Reporting section at the top of the list.
Local Insights
The first thing you’ll notice is a DMA-level snapshot, including indicators that show year-over-year trends in visits, mobile visits and unique visitors within your region.
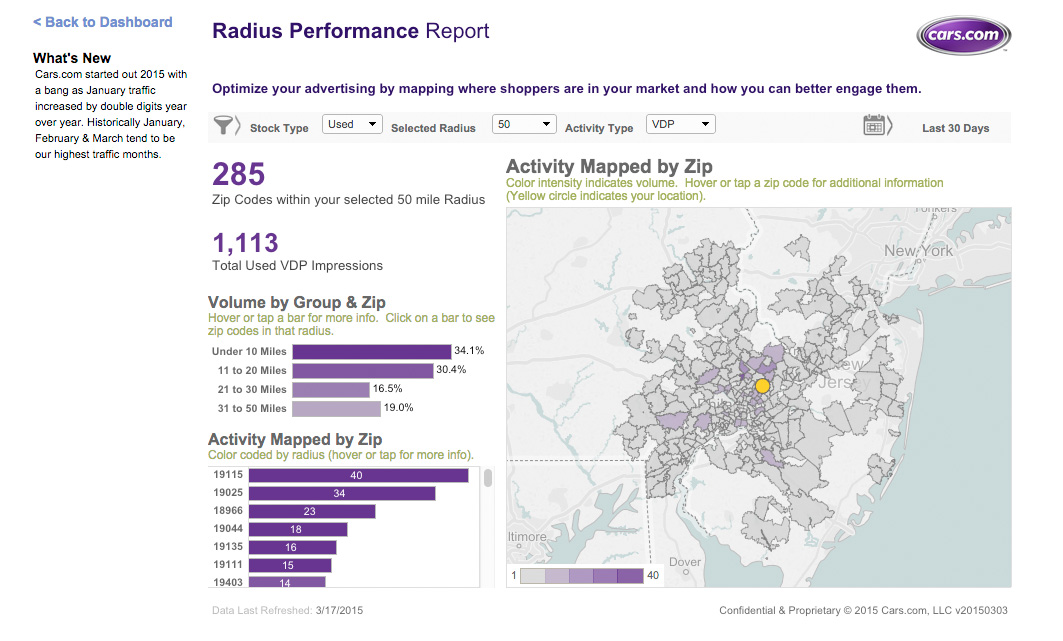
Go one step further and click the Radius Performance link on the left-hand side of the page. The report will feature a variety of drop down menus as well as an interactive map.
Take a hard look at it…seriously.
By analyzing your performance at a zip code-level, you can begin to understand local trends and tailor your marketing to be more efficient.
Here’s what I mean. This single-point franchise dealership draws the majority of its new-car Vehicle Detail Page (VDP) views in clusters along the eastern, central and southwest areas of Philadelphia.
No big deal, right?
Wrong. When you toggle over to used-car VDPs and impressions, it’s clear that used-car shoppers in the market are very different. They’re highly decentralized, viewing dealership content from all over town, including some remote areas.
But why does that matter?
Pretend you’re targeting ads through Cars.com, search, direct mail or any other marketing channel. Would it make sense to hit those new-car heavy areas with primarily manufacturer and service messaging or would used-car specials be more relevant? The new-car message is the obvious choice.
Inventory Basics
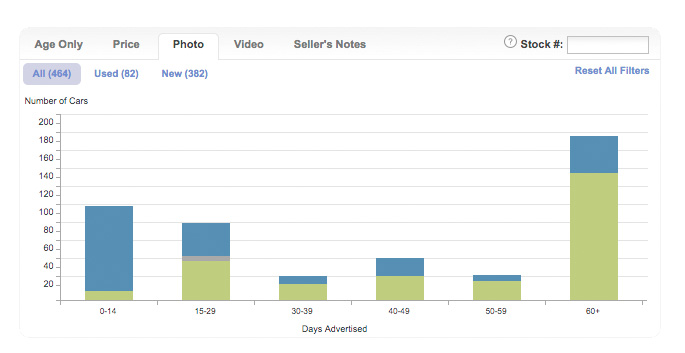
Next, jump back to the primary dashboard and take a peek at the Vehicle Snapshot report. Within it, you’ll see a quick overview of your current merchandising stats. These are your vitals.
If the percentage dips on your new and used inventory with photos, price and seller’s notes, you can bet the overall health of your dealership will bottom out with it.
While a lot of stores have this down pat, those that don’t fail to realize the importance of getting the fundamentals right. Without photos and price, you’ll see Search Results Page (SRP) to VDP conversion drop; without seller’s notes and dealer reviews, you’ll likely see fewer walk-in connections.
This stuff matters to consumers, and if you’re not taking it seriously, consumers won’t take you seriously either.
On the left side of the screen, you’ll see a list of related deep-dive reports. The two tabs I’ll call out are Current Inventory and Vehicle Demand.
In the Current Inventory report, you can look at your inventory on a per-vehicle basis to help determine you inventory turn, merchandising health and aggregate performance within 10 to 15 day intervals. If a car has been on the lot (and on Cars.com) for more than 30 days, you’ll see exactly what you need to tune up, in terms of pricing and merchandising, to help move that car off the lot.
The Vehicle Demand report, on the other hand, acts as a forecast. It shows current make/mode/year-specific searches and vehicle removals, which correlate closely with actual in-market vehicle sales. Use it as way to help weigh inventory acquisition opportunities and new-car incentives.
Think Connections, Not Leads
Finally, I want to reiterate the importance of looking beyond phone call and email metrics when evaluating the success of digital marketing. Let me be clear: The majority of car shoppers don’t send traditional leads before visiting the dealership, and they haven’t for some time; they arrive on your lot and expect to do business with you. It’s that simple.
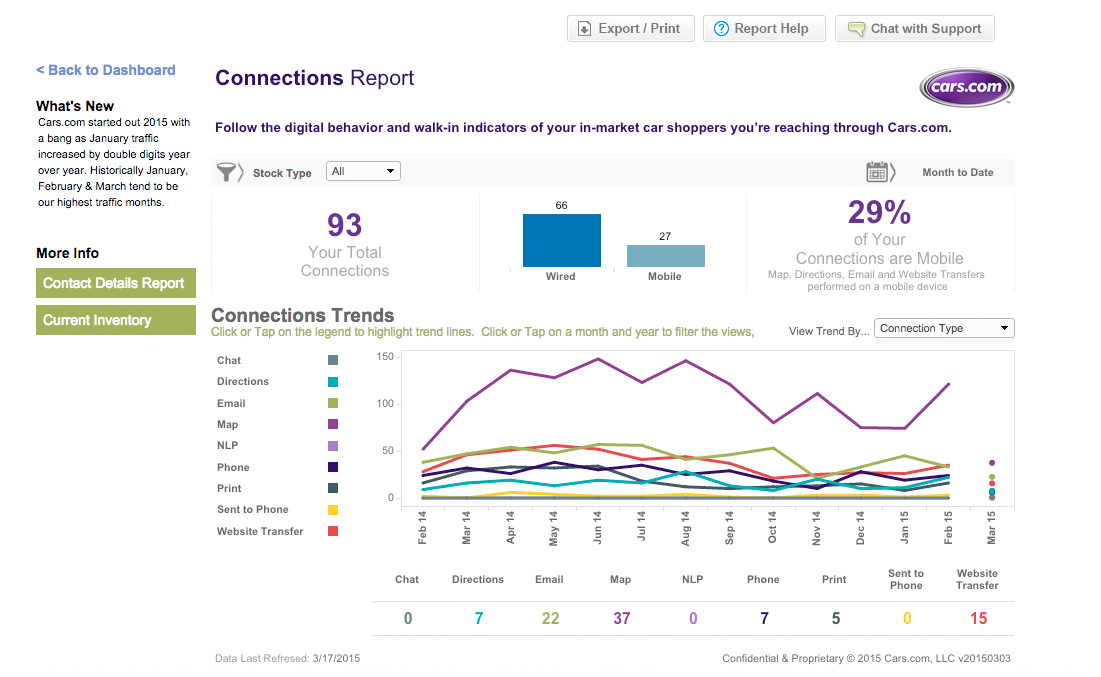
Jump back to the main reporting dashboard and scroll to the Connections Snapshot at the bottom of the page. You’ll see a monthly breakdown of both traditional leads (e.g., emails, phone calls) and contacts (e.g., website referrals, map views, etc.). In this example, which is similar to dealerships all across the country, leads are down while contacts are up – a telling sign of the way the industry is moving.
Drill down on the Connections tab to go into even greater detail.
More often than not, if you sort by connection type (just click the line graph), you’ll find that Map Views, Directions and Web Transfers are heavily weighted toward mobile, while Email connections skew toward the wired Cars.com site.
Think about that. What does that say about the new role of smartphones in the shopping process and how consumer behavior has evolved?
It’s no longer enough to tally the numbers and move on to the next month. To be truly successful as a dealership, you’ve got understand that whether they raise their hands or not, potential customers can are seeking you out across all devices at any time online.
Now let’s get to it.
3 Things To Do Today
- Get Signed Up – If you, your GM or DP don’t have access to the new Cars.com reporting suite, make a phone call or send a text to your local rep today. Then, schedule some time to walk through the new reporting tools in person.
- Check Your Vitals – Do all of your vehicles (new, used and certified pre-owned) have an accurate price, quality photos and relevant seller’s notes listed? Is your Cars.com dealer profile fully completed? Have you responded to all of your recent dealer reviews? Before you get into the nitty-gritty of our new reporting, make sure to nail the basics.
- Plan Your Next Move – Work with your Cars.com rep to plan a strategy using the insights from our new reporting. Is local dealership brand awareness low? Do have aged inventory to move? From inventory acquisition and pricing to local marketing tactics, the information within our new reporting suite is relevant beyond Cars.com. Use it to your advantage as a part of your overarching digital marketing strategy.


