Google Analytics is the “Up Log” for your virtual showroom. It is critical for dealers to develop the skills needed to inspect the website traffic that they are generating through their marketing efforts. Every dealer has their own unique online marketing strategy. However, there are a set of tasks that must be integrated into monthly inspection of campaign performance at the dealership.
Recently, I have been writing about my concerns regarding email conquest campaigns. You can read the entire series of articles by visiting my LinkedIn profile. In this blog post I will outline how dealers can create a Google Analytics segment to identify suspicious website traffic. I will define suspicious as a high number of clicks to pages that consumers normally do not visit.
Even though dealers see hundreds of thousands of visitors to their website each year, only a very small percentage of the visitors will click on the dealership’s privacy page, copyright page, or sitemap. These pages appear at the bottom of each website page and are often referred to as footer links.
If any paid marketing campaign has a high spike in footer link clicks, it should setoff an alarm at the dealership. It could be an indication that paid advertising traffic is not coming from real consumers but rather the traffic is being generated by automated “bots.”
One Year Of Traffic
In the image below, I have displayed the traffic to a Nissan dealership’s website over the course of one year. You will see that I applied a segment called “Footer-Links-Inspection-DealerOn” because they have a DealerOn website. I created this segment to show visits to specific pages that only appear at the bottom of each website page; footer links. The total visitors to this dealership’s website in this time period were 152,000.
You will notice that the spikes in traffic are associated with email marketing campaigns. One is from a Conquest Email Company and the other, a campaign being resold by their local cable company.
With 152,000 annual website visitors coming from AdWords, YouTube, Social Media, Direct, and Organic channels, why would only these two sources have an interest in these obscure pages?
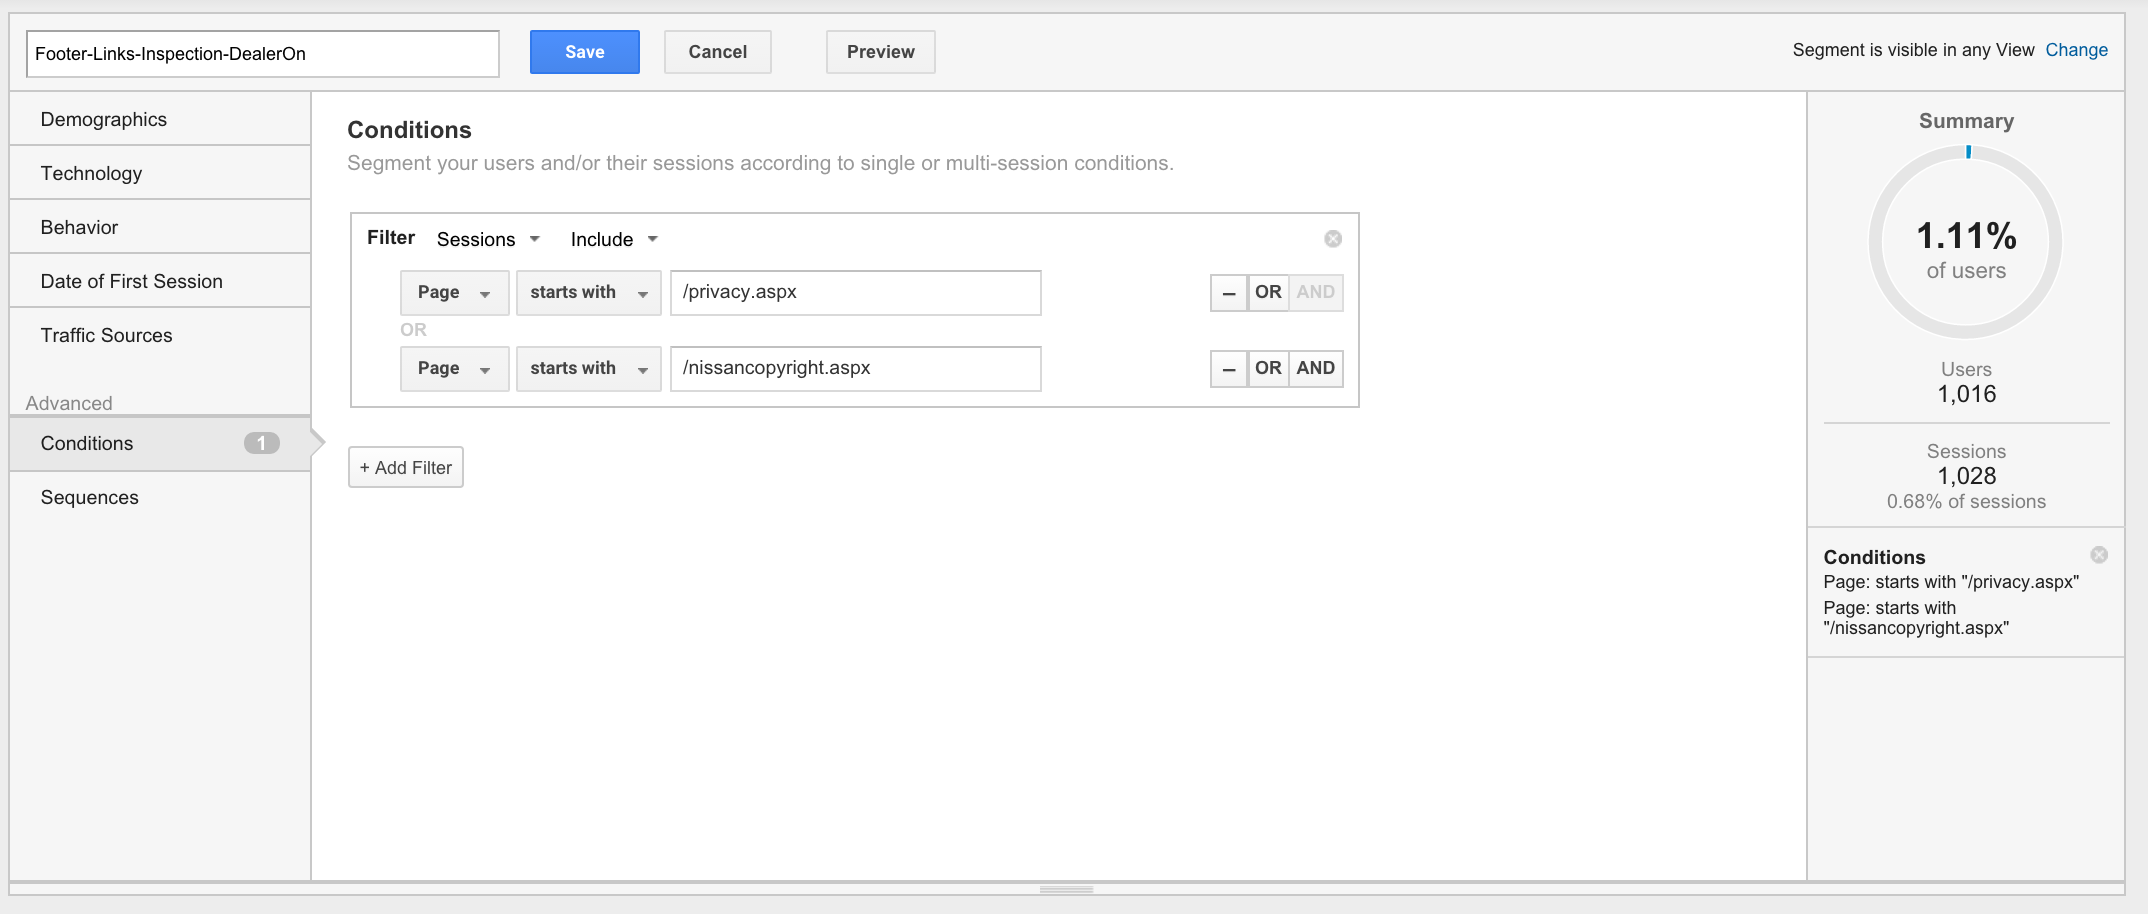
How did I create this segment? Here is what the segment definition looks like in Google Analytics. When you create the segment you will want to use the “Page” field and the “starts with” modifier. Don’t forget to start each page with a “/” and if you do it correctly, you will see user traffic calculated. For example, 1,016 people clicked these pages, which is high but you will learn why.
The key to making these segments work is to ONLY use pages that appear in the footer of each page that are NOT in the main navigation. You will often see “Contact Us” or “Directions” links in the footer but these pages are also in the main navigation. In the example above, this dealer had a specific Nissan Copyright page, so that may not appear on your DealerOn website.
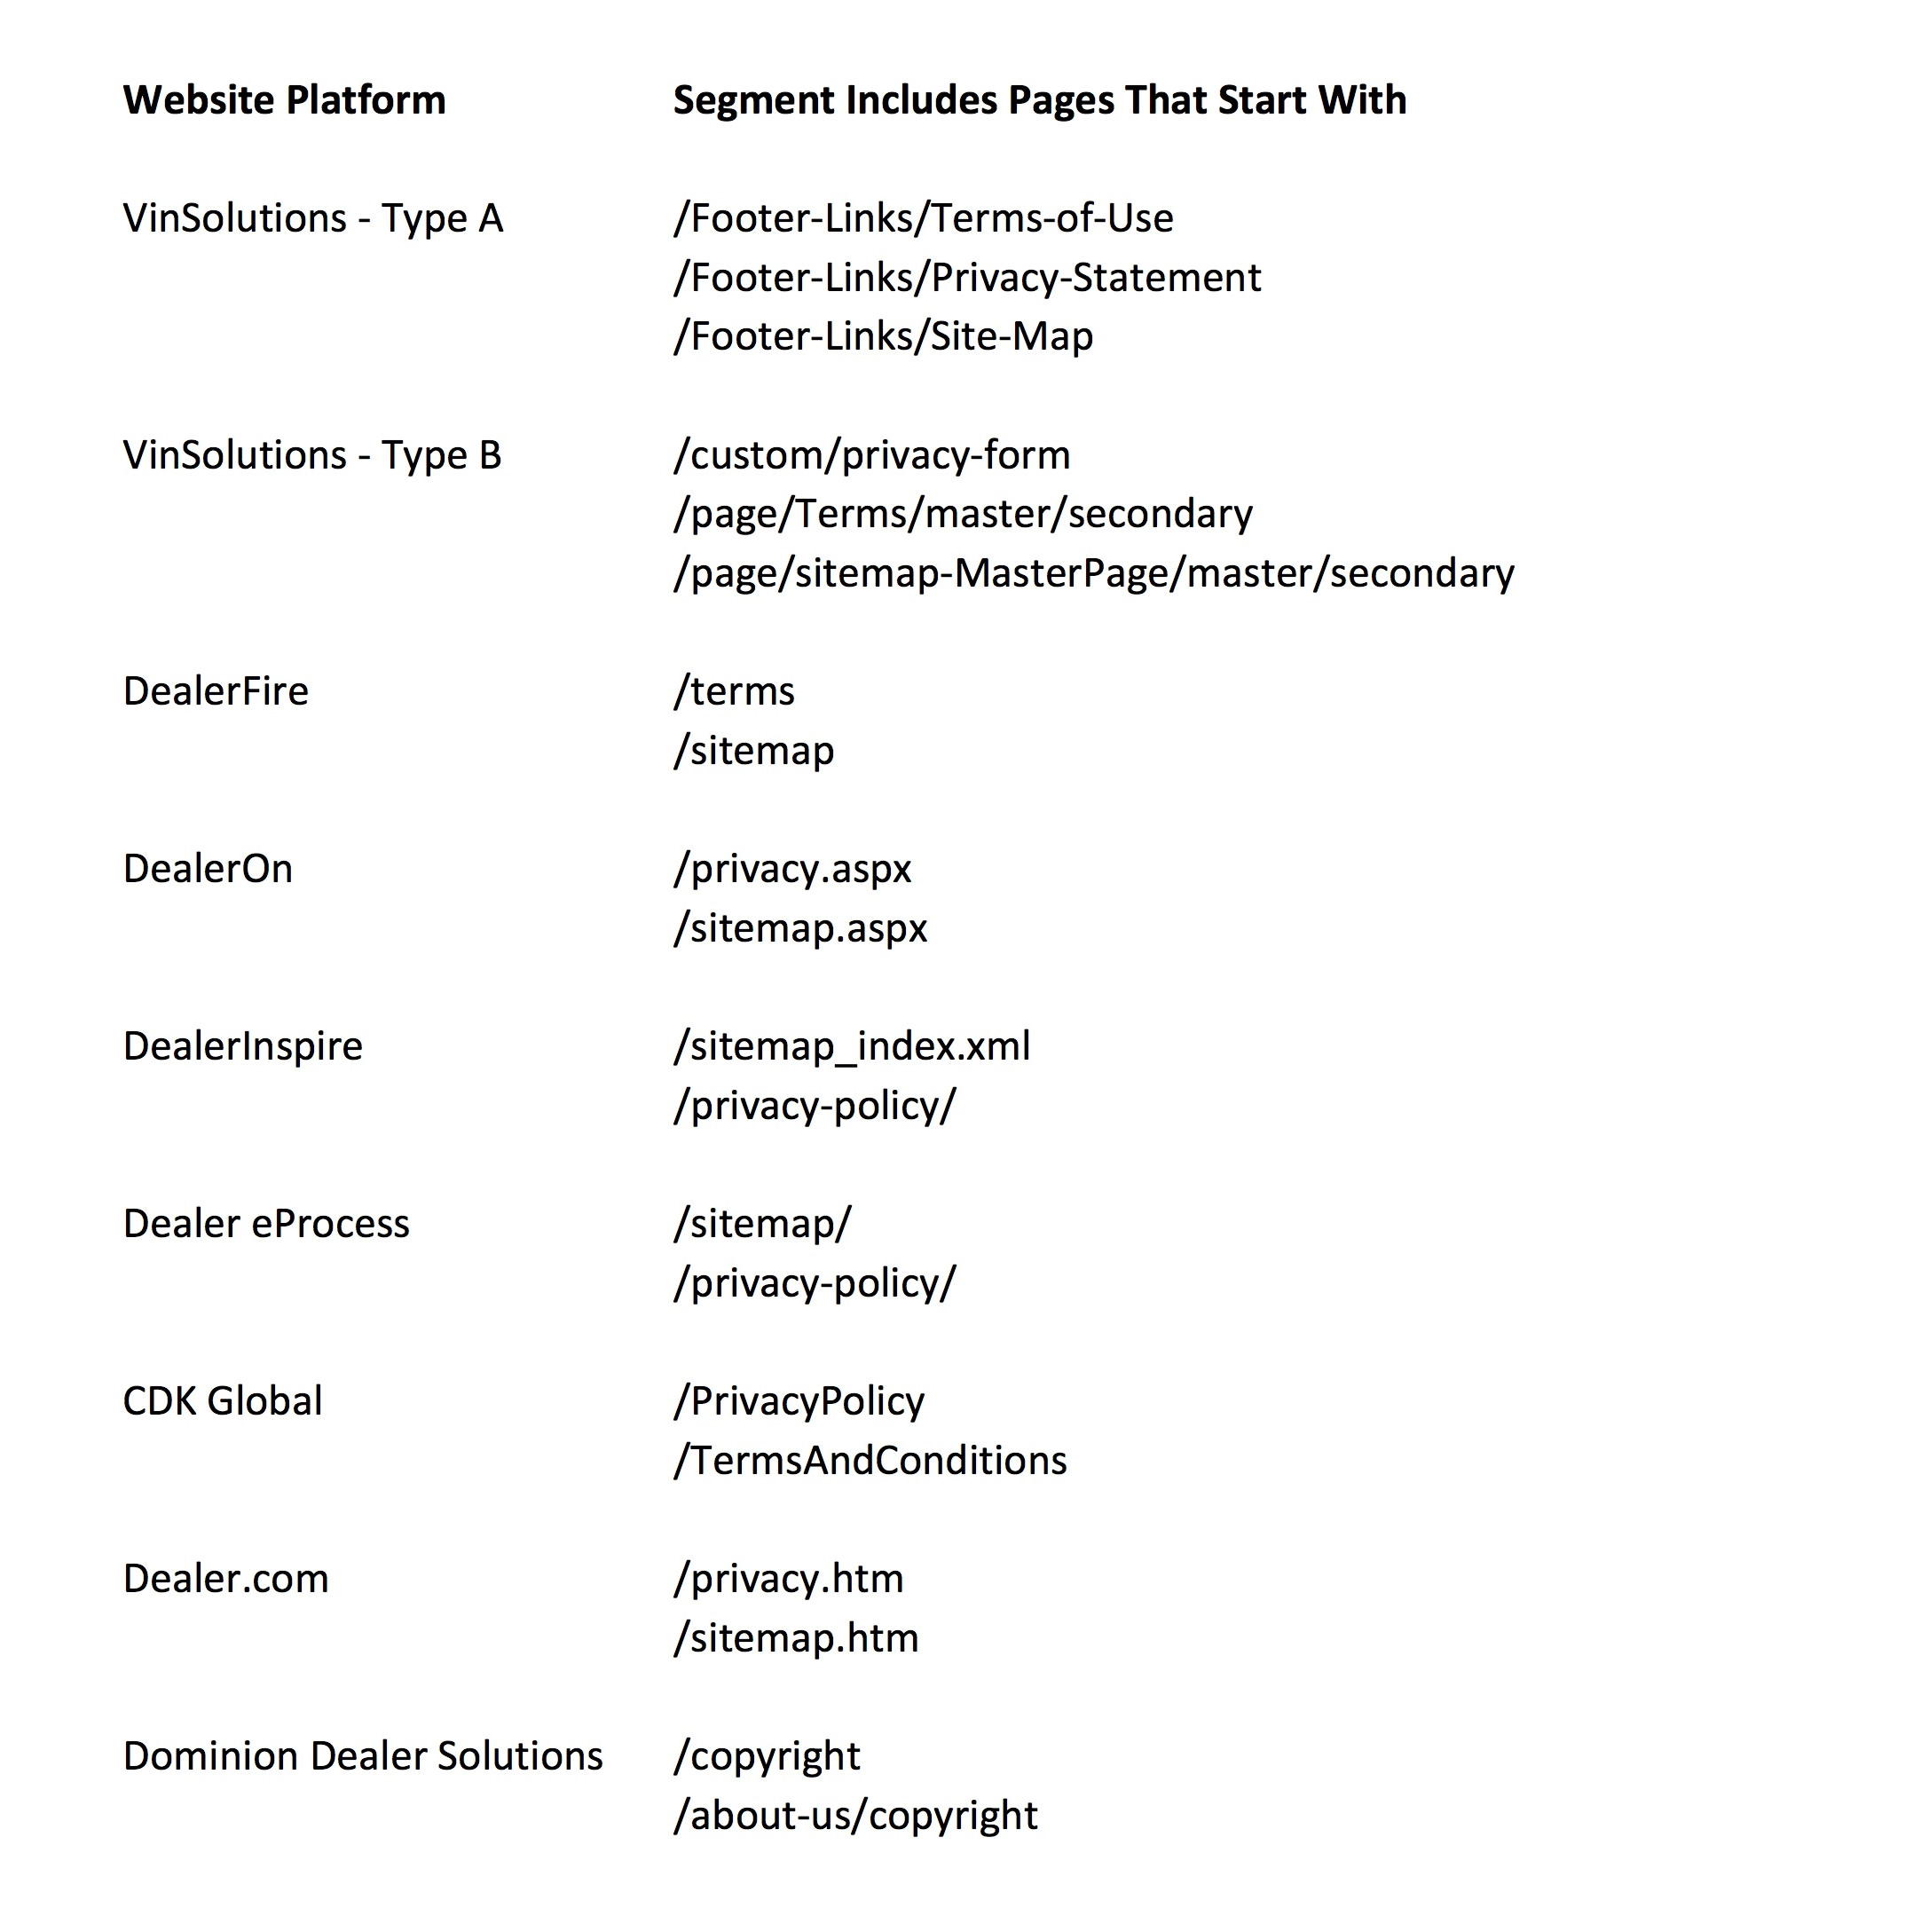
To make it easy for readers, I have compiled a list of pages that appear in the footer of common website platforms. These pages can be used to create a segment for your own website platform.
Last Step
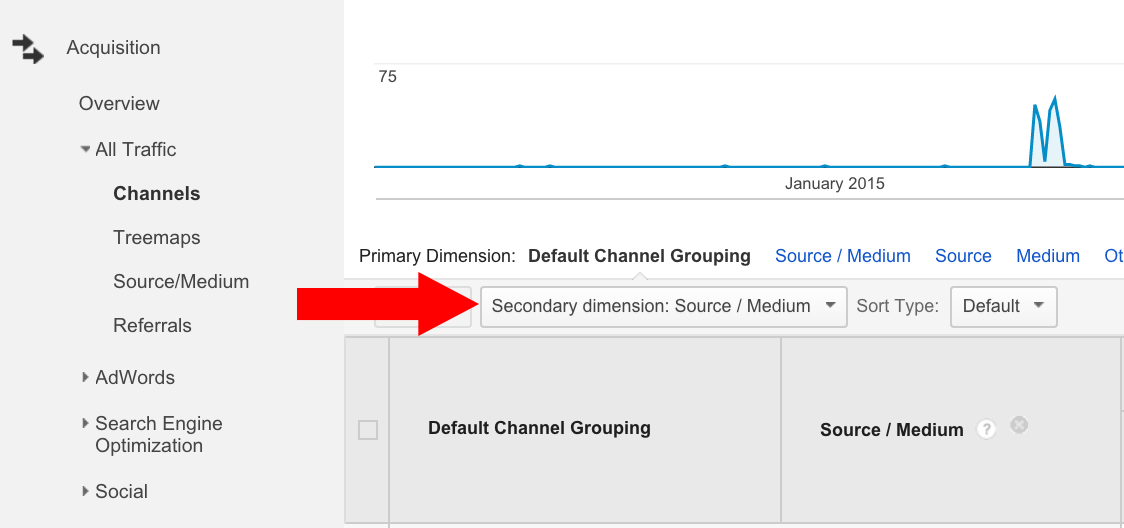
After you create this segment, you will want to change the secondary dimension to “Source/Medium” as shown below. This will organize the traffic by company or by source, whichever is marked in your Google Analytics account by the supplier. When you inspect your traffic, you MAY NOT see any large spikes in traffic and that is a good result.
However, if you find large spikes, then please reach out to me so I can help you understand and resolve your traffic concerns. You can email me at [email protected].


