
An Experiment Using AdWord’s Demographic Targeting
Background
A while ago I read an article on the Washington Post about how the F-150, and most other trucks, became a plaything for the rich. A quote from the author got me thinking about a using a new approach to my PPC truck campaigns for my clients:
The truck’s turn from rugged back-roads to glitz and luxury has driven its price twice as high as the average car or truck sold in the U.S. this year – pricier even than upscale SUVs from Porsche and Mercedes-Benz.
If the article is true, that the F-150 and other trucks have gone upmarket, then I should re-work my PPC campaigns for my volume truck dealers. If the campaigns are optimized according to what the article states then I could save my dealerships thousands in ad spend by targeting only demographics that are more likely to convert – high income households.
The goal of this experiment is to lower the CPA while increasing conversion volume so we’ll be able to spend less in the future and receive more qualified leads. I’ll be taking advantage of AdWord’s advanced demographic targeting to help me find the winning campaign.
Let’s see what happens…
The Control
The control is a successful campaign in the Display network from a large volume dealer in the North East. This campaign will be cloned 4 times and paused while the experiment is running. The results of the 4 experiments will be measured against this campaign.
The Experiment
I used a set of rules that each campaign must follow to help me determine the winner:
- Create 4 identical Truck campaigns, each with the same targeting, bidding, settings and ads.
- Separate the 4 campaigns by adding Demographic targeting. Target by household income tier.
- Campaign #1: Top 10% Income
- Campaign #2: 11 – 20% Income
- Campaign #3: 21 – 30% Income
- Campaign #4: Lower 50% Income
- Run for six weeks.
- Analyze results to determine which experiment exceeded the control in conversion volume and CPA.
Once the top performing campaign is determined we can scale it and pause the other experiments.
The Results
After running the experiments for six weeks I was excited to see a clear winner emerge. Here’s 3 views on how the demographic targeting based on household incomes reacted:
View 1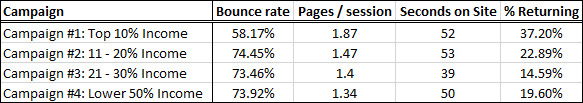
The amount of clicks, impressions, and costs that accrued over 6 weeks are relatively spread even. The Top 10% income earners had the highest CTR, but the bottom 50% had the best CPC.
Now let’s add conversion data to this set:
View 2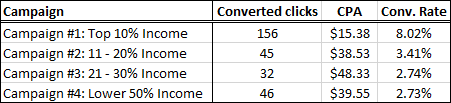
The Top 10% earners are the runaway favorite when looking at conversion data. An impressive 156 converted clicks, and a conversion rate that’s more than double the experiment average of 4.23%! In fact, the converted click volume for the Top 10% is greater than all the other demographics combined.
We’re not done yet. The conversion data is impressive, but let’s take a look at the site engagement metrics:
View 3
Another knockout punch by the Top 10% – we have a clear winner.
In fact, just by comparing rates between all experimental campaign we can see that the Top 10% wins in almost every category:
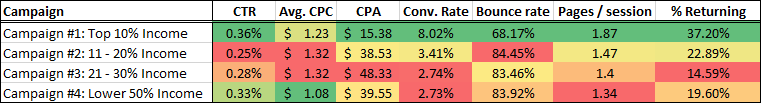
It was at this phase when I decided to pause the other experiments and increase the budget for our winner. I’m pleased to say that this experiment ended up being a big win for the dealership.
What do you think?
Are you utilizing Demographic targeting within Paid Search Campaigns?
Have a question or something to add… join the conversation over in the dealer forums